Online Data Analysis Instructions
Online data analysis
The Inter-university Consortium for Political and Social Research (ICPSR) distributes the Chitwan Valley Family Study (CVFS) public-use data at no charge through its Data Sharing for Demographic Research (DSDR) project. Public-use data are available for analysis on the ICPSR website. To use the online analysis tools, follow the instructions below. The ICPSR YouTube Channel also offers a playlist called “ICPSR User Support – Using SDA, includes webinar on SDA” that provides instructions on using Survey Documentation Analysis (SDA) for online data analyses.
Chitwan Valley [Nepal] Family Study series
Create a new MyData account on the ICPSR website or log into your existing MyData account here. Then select the study containing the public-use data that you want to analyze online. Two studies make up the CVFS series:
- The Changing Social Contexts and Family Formation study (ICPSR 4538).
- The Labor Outmigration, Agricultural Productivity and Food Security study (ICPSR 36755).
Select the study by using the links above, or enter the study number into the search bar on the website and select the study from the search results. Then select “Analyze Online”. A new window will open with options for Full Analysis Capabilities (SDA), Freqs/Crosstabs (modified SDA), and Freqs/Crosstabs (StatSnap) for each CVFS public-use data file. After selecting one of these three options, you will be directed to a new window and will be asked to read and agree to the “Terms of Use.” Select “I Agree” to proceed with data analysis.
Freqs/Crosstabs (modified SDA)
- Selecting Variables for Analysis
Select variables for analysis using the following steps:- Selecting variables in the original dataset for analysis:
- To select a variable in the original dataset, use the variable tree menu on the left side of the screen to find the names of your desired variable.
- To unfold a variable folder in the tree menu, click the name of a section. To collapse a variable folder in the tree menu, click the name of the section again. To learn more about a variable, click on the name of the variable.
- To select a variable for analysis, click on the bar next to the corresponding field in the center of the screen (“Row”, “Column”, etc.). Begin typing the name of the desired variable to filter the pop-up list and click on the desired variable or scroll through the pop-up list and click on the desired variable. To learn more about a particular field, click the field name.
- Select your “Row” variable:
![Chitwan Valley [Nepal] Family Study: Changing Social Contexts and Family Formation, Family Planning Data, Public-Use - • Select your “Row” variable:](https://cvfs.isr.umich.edu/wp-content/uploads/2021/05/select_your_row_variable.png)
- Select your “Column” variable:
![Chitwan Valley [Nepal] Family Study: Changing Social Contexts and Family Formation, Family Planning Data, Public-Use - Select your “Column” variable:](https://cvfs.isr.umich.edu/wp-content/uploads/2021/05/select_your_column_variable.png)
- Selecting variables in the original dataset for analysis:
- Selecting Table Options
To select table options, including optional control variables, selection filters, type of percentaging, and display of summary statistics, manually type in, or check the boxes where appropriate on these options listed below ‘row’ and ‘column’ variable bars.- Running the Analysis and Viewing the Results
To run the analysis, click the “Build the Table” button at the bottom of the page. - Upon clicking the “Build the Table” button, your frequency distribution and chart will present in a new window:
![Chitwan Valley [Nepal] Family Study: Changing Social Contexts and Family Formation, Family Planning Data, Public-Use - Frequency Distribution](https://cvfs.isr.umich.edu/wp-content/uploads/2021/05/frequency_distribution.png)
![Chitwan Valley [Nepal] Family Study: Changing Social Contexts and Family Formation, Family Planning Data, Public-Use - chart](https://cvfs.isr.umich.edu/wp-content/uploads/2021/05/chart.png)
- After clicking on “Build the Table”, you can also revise the display of the analysis. To revise the display of the analysis, use the options on the left side of the screen to customize the display. Click the “Revise Display” button at the top or the bottom of the display options on the left side of the screen to update the display.
- Running the Analysis and Viewing the Results
Full Analysis Capabilities (SDA)
- Selecting an Analysis Program
Click the “Analysis” tab at the toolbar at the top of the main SDA screen, and select a program. Run frequency or crosstabulation is the default program.![Chitwan Valley [Nepal] Family Study: Selecting an analysis program](https://cvfs.isr.umich.edu/wp-content/uploads/2021/05/frequencies-crosstabulation.png)
- Selecting Variables for Analysis
Select variables for analysis using the following steps:- Selecting variables in the original dataset for analysis:
- To select a variable in the original dataset, use the variable tree menu on the left side of the screen to find your desired variable.
- To open a variable folder in the tree menu, double click the folder name or click the “+” next to the folder. To collapse a variable folder in the tree menu, double click the folder name or click the “–” next to the folder.
- To select a variable for analysis, click on a variable to move it to the “Selected” box.
- Recoding or computing variables:
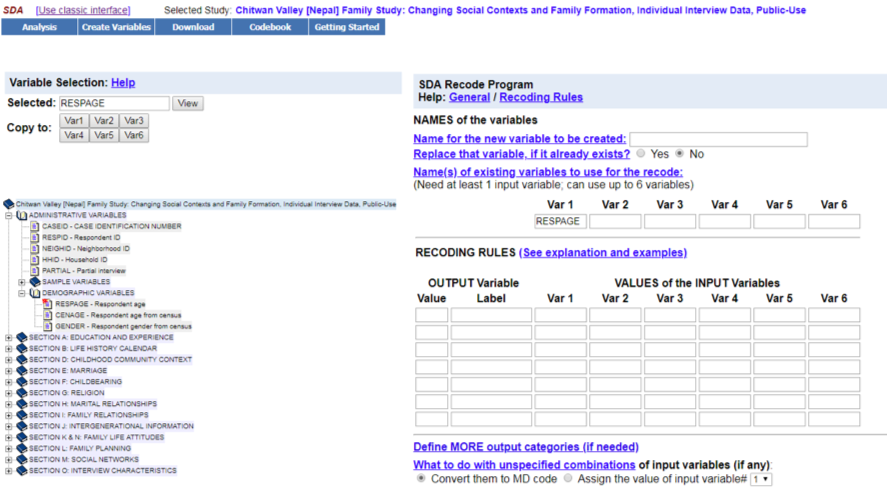
To recode variables:- Click the “Create Variables” tab at the toolbar at the top of the main SDA screen and select “Recode variables”.
- On the right side of the screen is the SDA Recode Program form. To populate the form, type the variable names into the program fields, or use the variable tree menu to move variables to the “Selected” box and click the appropriate button in the “Copy to” row (“Var1”, “Var2”, etc.) to copy the variable to the corresponding field in the recode program.

- Fill in the recoding rules in the SDA Recode Program form. For more detailed instructions on writing the recording rules, click on “See explanation and examples” next to “Recoding Rules”.
- After all the appropriate Recoding Form fields are populated, click “Start Recoding”.
- For more detailed instructions and help on recoding variables, click on “General” at the top of the Recode Program form, or on individual field names that are blue and underlined.
To compute a new variable:
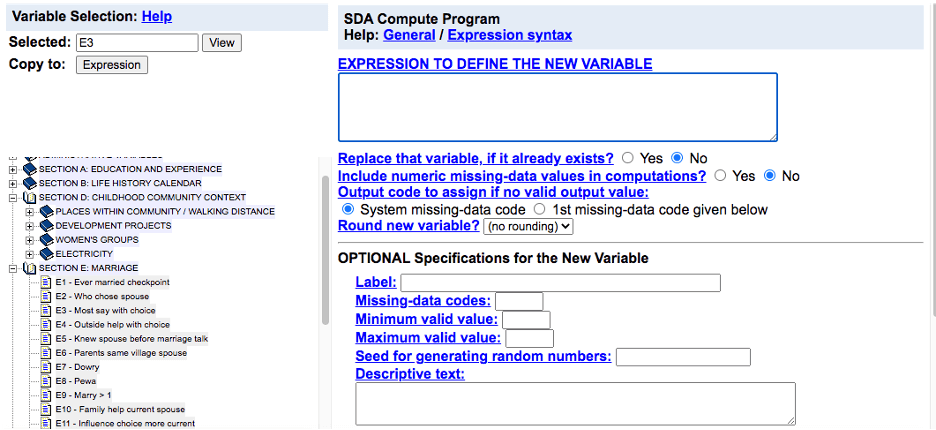
- Click the “Create Variables” tab at the toolbar at the top of the main SDA screen and select “Compute a new variable”.
- On the right side of the screen is the SDA Compute Program form. To populate the field “EXPRESSION TO DEFINE NEW VARIABLE”, type the variable names into the field or use the variable tree menu to move variables from the “Selected” box to the field. For instructions on writing the expression, click on the field name or on “Expression syntax” at the top of the SDA Compute Program form.

- After all appropriate SDA Compute Program form fields are populated, click “Start Computing”.
- For more detailed instructions and help on computing a new variable, click on “General” at the top of the SDA Compute Program form, or on individual field names that are blue and underlined.
- Selecting recoded or computed variables for analysis:
- Click the “Create Variables” tab at the top of the main SDA screen. Then, click “List Selected Variables” in the submenu to see the list of created variables, and click on a variable from the list to move it to the “Selected” box.
![Chitwan Valley [Nepal] Family Study: list derived SDA variables](https://cvfs.isr.umich.edu/wp-content/uploads/2021/05/list_derived_SDA_variables.png)
Click on View:![Chitwan Valley [Nepal] Family Study: RECODEDK1](https://cvfs.isr.umich.edu/wp-content/uploads/2021/05/recodedk1.png)
- Click the “Create Variables” tab at the top of the main SDA screen. Then, click “List Selected Variables” in the submenu to see the list of created variables, and click on a variable from the list to move it to the “Selected” box.
- Populating the analysis program fields with variables:
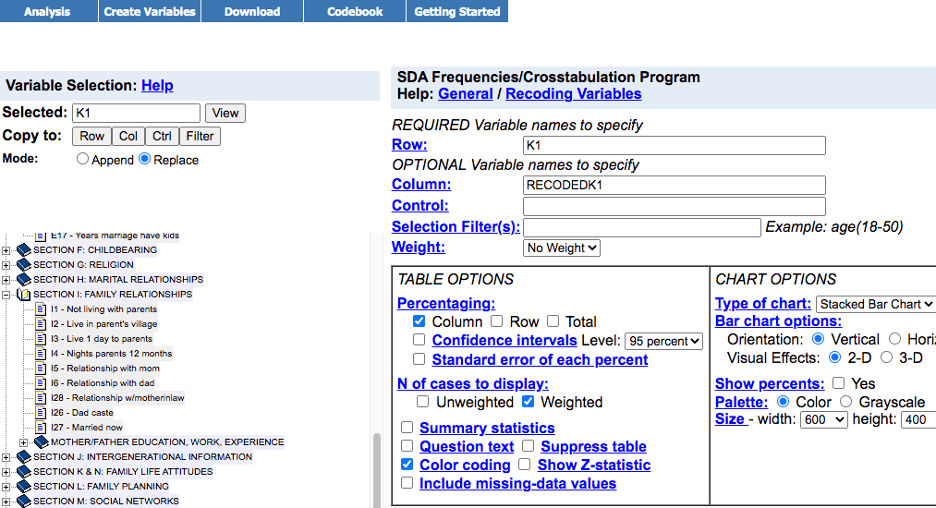
- The right side of the SDA screen contains the analysis program form. To populate the program form, once a variable is in the “Selected” box, click on the appropriate button in the “Copy to” bar (“Row”, “Column”, etc.) to copy the variable from the “Selected” box to the corresponding field in the program form OR type the variable name directly into the program form field.
- To add a variable to a program form field that already has a variable, navigate to the “Mode” bar found under the “Analysis” tab when you select one of the following options: 1. Run a frequency/cross tabulation (with charts), 2. Comparison of means, or 3. Comparison of correlations. Next, click on the “Append” button beside the “Mode” bar OR type the multiple variables with a space in between them directly into the field..
- To overwrite a variable in a program form field, go to the “Mode” bar and select “Replace” OR delete the variable name and type the replacement variable directly in the field.

- Selecting variables in the original dataset for analysis:
- Selecting Analysis Program Options
Use the additional fields in the analysis program form on the right side of the main SDA screen to customize analysis and display of results. Click on field names that are blue and underlined to learn more about each option. - Running the Analysis and Viewing the Results
To run the analysis program, click the “Run” button. The specific words on the button will vary based on the analysis program (for example, “Run the Table” or “Run Correlations”). When the program is finished running, a new browser tab displaying the results will appear.
Freqs/Crosstabs (StatSnap)
- Select Analysis
Select from ‘Frequencies’, ‘Crosstabs’, or ‘Data Preview’.- Frequencies:
- Select variable(s) from the list. Each variable selected will be added to the ‘Selected Variables’ box.
![Chitwan Valley [Nepal] Family Study: select analysis](https://cvfs.isr.umich.edu/wp-content/uploads/2021/05/select_analysis.png)
- Select ‘Bar’, ‘Line’, or ‘Pie’ under ‘Plot Type’ to output a bar, line, or pie graph under each frequency table.
- Select either ‘Counts’ or ‘Percents’ to be outputted.
- Click ‘Run’ at the bottom of the page.
![Chitwan Valley [Nepal] Family Study: run](https://cvfs.isr.umich.edu/wp-content/uploads/2021/05/run.png)
![Chitwan Valley [Nepal] Family Study: frequencies](https://cvfs.isr.umich.edu/wp-content/uploads/2021/05/frequencies.png)
- Select variable(s) from the list. Each variable selected will be added to the ‘Selected Variables’ box.
- Crosstabs:
- Select variable(s) from the list by clicking ‘Row’, ‘Col’, or ‘Ctrl’ under the variable name.
![Chitwan Valley [Nepal] Family Study: crosstabs: select variables](https://cvfs.isr.umich.edu/wp-content/uploads/2021/05/crosstabs_select_variables.png)
- To recode any variable, click on the ‘Recode’ button and a new window will populate. Select a variable. Choose an ‘Operator’ option from the dropdown menu (=, <, >, between, etc.). Manually key in the old value and the new value. Click ‘Add Rule’ and continue this process until all rules are added. Last, add a new variable name and description if wanted. Click ‘Apply Recoding’.
![Chitwan Valley [Nepal] Family Study: recode](https://cvfs.isr.umich.edu/wp-content/uploads/2021/05/recode.png)
- After all variables are selected and recoded, select ‘Row’, ‘Column’ and/or ‘Total’ under ‘Percentage’ to output frequencies and percentages.
- Select ‘Bar’, ‘Pie’, ‘Donut’, or ‘Stacked Bar’ under ‘Chart Type’ to output a bar, pie, donut, or stacked bar graph under each crosstabulation.
- Click ‘Run’ at the bottom of the page.
![Chitwan Valley [Nepal] Family Study: recode run](https://cvfs.isr.umich.edu/wp-content/uploads/2021/05/recode_run.png)
![Chitwan Valley [Nepal] Family Study: crosstabulation](https://cvfs.isr.umich.edu/wp-content/uploads/2021/05/crosstabulation_GENDRC1.png)
![Chitwan Valley [Nepal] Family Study: Gender child](https://cvfs.isr.umich.edu/wp-content/uploads/2021/05/gender_child2.png)
- Select variable(s) from the list by clicking ‘Row’, ‘Col’, or ‘Ctrl’ under the variable name.
- Data Preview:
- Browse the data by using the vertical and horizontal scroll bars.
![Chitwan Valley Family Study: Changing Social Contexts and Family Formation, Nepal, 1996-2008 [Study: 4538 | Dataset: 15]](https://cvfs.isr.umich.edu/wp-content/uploads/2021/05/data_preview.png)
- Browse the data by using the vertical and horizontal scroll bars.
- Frequencies:

